

Next’s international online sales grew 36.9% in the second quarter. Its UK online sales grew 5.0%.
That is a gap of more than seven times between two halves of the same business, selling broadly the same clothes, in the same three months.
The trading statement published on 5 August put total full price sales up 9.2% for the quarter, against a forecast of 4.0%, which the company put at roughly £70 million ahead of where it expected to be.
The Half Went in Two Directions at Once
The quarterly and half-year figures together say something the quarter alone does not.
Across the first half, UK online grew 7.4% and international online grew 23.9%. In the second quarter alone, UK online grew 5.0% and international grew 36.9%.
Work backwards and the direction of each is clear. UK online must have been growing faster in the first quarter than the second, because the half-year figure sits above the Q2 figure. International must have been growing considerably slower in the first quarter, because the half-year figure sits well below it.
So one business decelerated through the half and the other accelerated sharply. The headline number, a healthy 9.2%, is the average of two trends moving in opposite directions, and the average is the least interesting thing about it.
Marketing Spend Was the Lever
The statement’s own explanation for part of the outperformance is worth quoting precisely: the company said it was “able to spend much more on profitable marketing than we had anticipated”.
The load-bearing word there is profitable. That is not a company saying it spent more and sales went up, which would be unremarkable and would say nothing about whether the money was well spent. It is a company saying it found more marketing that cleared its return threshold than it expected to find.
Those are different claims about the world. The first is about budget. The second is about the availability of demand that can be reached economically, which is a genuine constraint most marketers recognise: at some point additional spend stops paying for itself, and the useful question is where that point sits rather than how large the budget is.
Finding the ceiling higher than expected is a real and specific piece of news. It says the addressable demand was deeper than the company’s own model assumed, which is a more durable finding than a single good quarter.
The Stores Are Not Collapsing, They Are Fading
Retail stores fell 0.3% in the quarter and 1.7% across the half.
Those are small numbers, and it is worth being precise about what they mean. A 0.3% decline is not a crisis, and headlines about the death of the high street do not fit a business whose shops are within a rounding error of flat.
What they describe instead is slow relative decline. When one channel grows 36.9% and another shrinks 0.3%, the mix shifts every quarter without anything dramatic happening in either. Stores do not need to fall off a cliff to become a smaller part of the business; they only need to stand still while the rest moves.
That is a harder management problem than a collapse, because there is no moment that forces a decision. The estate keeps performing acceptably, and the strategic question of what it is for gets deferred another quarter.
The arithmetic of that drift is worth spelling out, because it runs faster than the individual growth rates suggest. Two channels growing at 36.9% and shrinking at 0.3% diverge by roughly 37 percentage points a year. Repeat that for three years and the faster channel is more than two and a half times its starting size while the slower one has barely moved, which reorders the business without any single year looking decisive.
That is the mechanism by which retail estates end up oversized. Nobody decides to have too many shops. The shops stay the same while everything around them grows, and the same floorspace that was correctly sized for the business five years ago is carrying a much smaller share of it today.
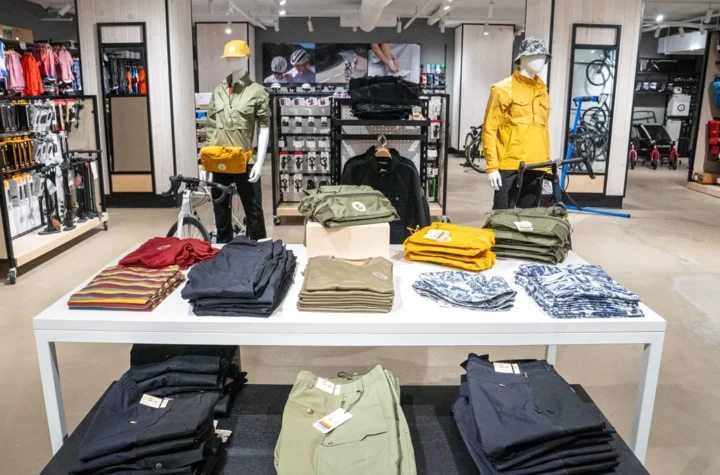
It also changes what the shops are for. A store in a business that is mostly stores is a place to sell things. A store in a business that is mostly online becomes something closer to a returns desk, a fitting room and a piece of advertising, and those functions are worth real money without showing up in that store’s own sales line at all.
Which means the 0.3% decline may not even be the right measure of the estate’s contribution. It is simply the only one the statement gives.
The Upgrade Looks Backwards
Next raised its full-year pre-tax profit guidance by £25 million to £1,243 million, an increase of 7.3% on last year. Full-price sales guidance for the year moved to 6.3%.
The detail that matters is what did not change. The forecast for the rest of the year was left at 5.0%.
So the 6.3% full-year figure is arithmetic, not optimism: it blends a first half that actually delivered 7.7% with a second half still forecast at the same rate as before. The company has banked the beat and predicted nothing new.
This is a conservative way to upgrade, and it is the opposite of what a company does when it wants a headline. Extrapolating the strong quarter forward would have produced a much larger number and required no additional evidence. Choosing not to means the guidance rise is fully explained by money already earned.
It also sets up a low bar. If international keeps compounding anywhere near its recent rate, the second half beats a forecast that was deliberately left untouched.
What Growing Abroad Actually Costs
A 36.9% growth rate invites the obvious question of why the company does not simply do more of it, and the answer is that international growth is not free.
Selling clothes across borders means carrying the cost of returns over longer distances, holding duty and tax exposure in multiple jurisdictions, running local-language service, and absorbing currency movement between the sale and the settlement. Each of those makes a given percentage of sales growth worth less in profit than the same percentage at home.
The statement does not break out international profitability, so the honest position is that the sales growth is verified and its margin contribution is not. Anyone treating 36.9% as though it drops through to the bottom line at UK rates is making an assumption the disclosure does not support.
This is the same discipline that applies to reading any strong headline figure, whether it is a growth rate or the gap between a reported and an adjusted profit number: check what the company has actually told you, and hold the rest as an open question.
The Question Left Open
The interesting uncertainty is whether the international rate is a level or a spike.
A 36.9% quarter against a 23.9% half means the acceleration is recent. Recent accelerations are the hardest thing in retail to read, because they can equally reflect a structural change in reach or a temporary run of favourable conditions that will not repeat against a harder comparison next year.
The next statement will settle it, because it will be measured against a quarter that was already strong. Growth against an easy base tells you very little. Growth against this one would tell you a great deal.
In the meantime, the two numbers worth carrying forward are these. The company found more profitable marketing than it expected, which is a statement about demand rather than about budget. And it declined to forecast any of that continuing, which is a statement about how confident it is that the demand will still be there. Those two sit slightly in tension, and the tension is the most honest thing in the release. It is a more careful reading than the one available from the sector-wide sales figures, which show the same summer from far enough away that a company growing 36.9% somewhere and 5% somewhere else looks simply like one that grew.
About The Author




More Stories
LearnUpon Secured $50m Without Selling a Single Share
La Cordée Is Closing With $13 Million Owed and 210 Jobs Lost
Pensioners Would Carry Half the Private Health Insurance Rebate Cut