
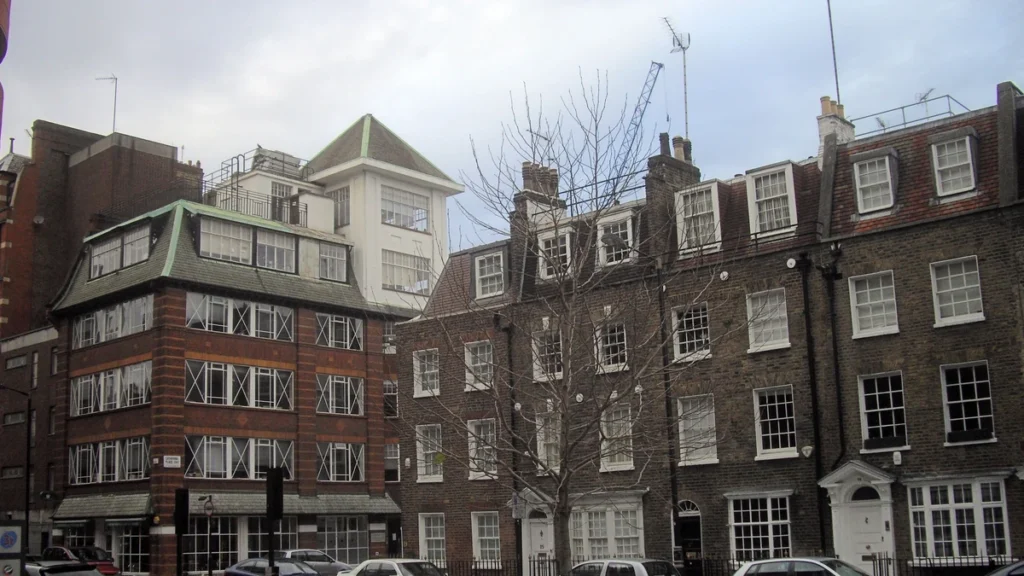
The average UK home was worth £272,000 in June 2026, which is £5,000 more than a year earlier and almost exactly what it was worth in May.
That second half of the sentence is the story. On a non-seasonally adjusted basis prices moved 0.1% between May and June; seasonally adjusted, they fell 0.2%. The annual figure still reads as growth because of what happened months ago, not because anything is happening now.
Annual Growth Halved in One Month
Annual house price inflation was 2.0% in the 12 months to June, according to the UK House Price Index. In the 12 months to May it was 3.0% on the revised estimate.
A drop of a third in the annual rate inside one month is a large move for a series this slow. It happens when a strong month drops out of the comparison and is replaced by a flat one, which is precisely what the monthly figures show: 0.1% this June against 1.0% in the same month a year earlier.
Both figures are provisional. This index is revised routinely and the May number has already moved once.
The gap between the two monthly measures is worth a second look, because it points the opposite way to the headline. Unadjusted, prices rose 0.1%. Seasonally adjusted, they fell 0.2%. June is normally one of the stronger months in the housing calendar, so the adjustment strips out an expected seasonal lift. A month that rises slightly in raw terms but falls once that lift is removed is a month that underperformed its own seasonal norm.
That is a more accurate description of June than either figure alone: not a decline, but a normally busy month behaving like an average one.
Four Countries, Four Different Markets
The national average conceals four quite different pictures.
England reached £293,000, up 1.8% over the year. Wales was £213,000, also 1.8%. Scotland was £195,000 and rose 2.3%. Northern Ireland, measured quarterly, hit £202,000 in the second quarter and rose 9.2%.
Northern Ireland is the outlier by a distance, growing more than four times as fast as England on a base roughly two-thirds the size. It is also the smallest and most volatile of the four series, so a single strong quarter carries further there than it would elsewhere.
London Has Fallen for Ten Months
Within England the spread is wider still. The North West recorded the highest annual inflation at 4.7%. London recorded the lowest at minus 2.5%.
That is London’s tenth consecutive month of annual price falls, driven by declines in Inner London. The index does note that the rate of annual fall has slowed, which is the first tentative sign of a floor rather than evidence of one.
The scale of the divergence is easier to see in cash than in percentages. On a London average, a 2.5% annual fall is a five-figure reduction in nominal value; on a North West average, 4.7% is a smaller cash gain on a much smaller base. The two regions are not simply growing at different speeds, they are moving in opposite directions on very different price levels, which is why a single national rate flatters one and understates the other at the same time.
Ten months is long enough to stop being a wobble. A market that has been declining for the better part of a year, while the North West runs at 4.7%, is not a national housing market having a soft patch. It is two markets moving in opposite directions inside the same statistic, and the 2.0% headline is the average of that disagreement rather than a description of either.
Transactions Held Up Better Than Prices
Volumes tell a slightly warmer story than values.
HMRC estimated 99,000 residential transactions above £40,000 in June on a seasonally adjusted basis, 2.5% higher than in June 2025, with a 0.2% increase on May. On a non-seasonal basis the month-on-month movements were larger and uneven: England up 13.1%, Wales up 12.0%, Northern Ireland up 3.7%, Scotland down 1.6%.
Rising transactions alongside flat prices is a healthier combination than the reverse. It suggests buyers and sellers are still meeting, just at prices that are no longer climbing.
The unadjusted country splits are too volatile to build a thesis on, but the spread between England at plus 13.1% and Scotland at minus 1.6% in a single month is a reminder of how thin these monthly samples get once they are divided four ways. Seasonal adjustment exists precisely because June-to-May comparisons are noisy, and the adjusted UK figure, plus 0.2%, is the one that carries weight.
There is also a compositional point buried in the national average. England alone averages £293,000 against a UK figure of £272,000. The UK number is not a typical English house; it is an English market blended with three smaller and substantially cheaper ones. Anyone using the £272,000 headline as a reference price for a scheme in the South East is reading the wrong statistic.
The Royal Institution of Chartered Surveyors reached a similar reading from a different direction, its June survey reporting that the headline house price indicator has shown signs of stabilisation in recent months.
The Forward Indicator Is Softer
The number that points ahead rather than back is mortgage approvals, and it is the least comfortable one here.
The Bank of England recorded 58,200 approvals for house purchase in June. That was an increase on the month, but it sits below the 61,400 average of the previous six months.
Approvals lead completions by roughly two to three months, so June’s figure is a partial view of the autumn. Below-average approvals do not imply falling prices, but they do make a reacceleration in the annual rate unlikely in the near term, and the annual rate is the number most commentary reacts to.
What It Means for the Building Side
For anyone whose business depends on housing rather than on owning a house, the operative fact is not the 2.0% but the geography underneath it.
A 4.7% North West and a minus 2.5% London imply different decisions about land, pricing and phasing within the same company. Volume housebuilders can move their weighting between regions; smaller firms usually cannot, which is one reason capacity at the bottom of the sector stays thin even when national figures look adequate, as the pattern where the smallest housebuilders sell ten homes a site a year illustrates.
The supply side has its own constraint that no price index captures, and it is administrative rather than financial: planning officers are 2,660 short and the gap is widening. Flat prices and a thin approvals pipeline reduce the incentive to push schemes through a system that is already slow.
The Honest Summary
Prices are 2% up on the year, flat on the month, and the annual figure is falling towards the monthly one rather than the other way round.
Northern Ireland is running hot, the North West is solid, London has been declining for ten months and is falling more slowly than it was. Transactions are marginally up, approvals are below trend, and the surveyors think it is stabilising.
None of that describes a correction, and none of it describes a recovery. It describes a market where the national number has stopped being informative and the regional ones have taken over.
About The Author





More Stories
LearnUpon Secured $50m Without Selling a Single Share
La Cordée Is Closing With $13 Million Owed and 210 Jobs Lost
Pensioners Would Carry Half the Private Health Insurance Rebate Cut