
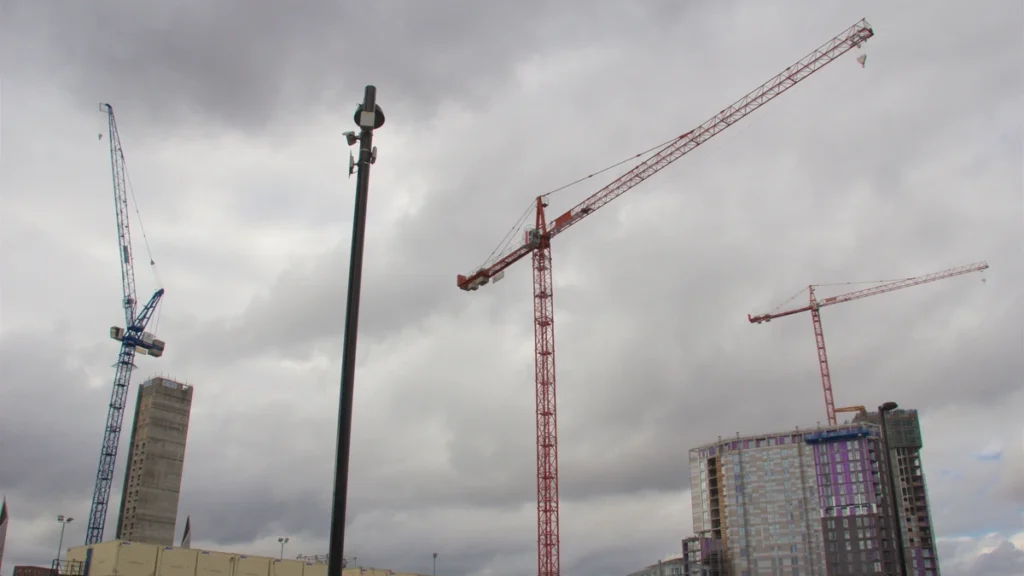
New orders for construction work in Great Britain fell by £1,232 million in the second quarter, a drop of 11.8% on the first.
Over the same three months, construction output rose 0.3%.
Both figures come from the ONS construction bulletin published on 13 August, and the gap between them is the whole story.
Every Month Fell and the Quarter Rose
The monthly path through the quarter was April down 0.1%, May down 0.8%, June down 0.1%.
Three consecutive falls, and yet the quarter as a whole was 0.3% above the first quarter. That is not an error, and it is worth understanding because the same construction will be reported in two opposite ways depending on which figure is quoted.
A quarter-on-quarter comparison measures the average level of the three months against the average of the previous three. If the quarter starts from a high base, output can decline steadily throughout and still average out higher than the period before. Here the base was March, which was particularly strong, and it lifts the whole of the second quarter’s average with it.
So the accurate summary is that construction was falling gently through the quarter from a high point, and the quarterly figure is describing where it started rather than where it is going.
Orders Are the Forward Number
Output tells you what was built. Orders tell you what has been agreed to be built next, which for anyone making a decision is the more useful of the two.
An 11.8% quarterly fall in new orders is a large move. It implies a first-quarter total of roughly £10.4 billion, against which £1.2 billion has come out in three months.
The ONS attributes the main declines to private commercial new work and public other new work. That combination is worth noting, because the two usually respond to different things. Private commercial construction tracks corporate confidence, occupier demand and the cost of borrowing. Public work tracks departmental budgets and procurement timetables. When both fall in the same quarter, the cause is either coincidence or something affecting them jointly, and a single quarter cannot tell you which.
Orders are also lumpy. One large scheme signing or slipping moves the total by a visible amount, which is exactly the distortion that makes single-quarter readings unreliable. The number to watch is whether the fall repeats.
The lag between the two series is what makes this quarter’s combination possible at all. An order signed today becomes output over the following months and years as the work is actually done, so a site under construction now is drawing down an order placed some time ago. Output can therefore hold up for several quarters after new orders weaken, because the industry is working through a backlog that was agreed under better conditions.
That is a reassuring mechanism in the short term and an unhelpful one for anyone trying to read the sector early. By the time falling orders show up in output, the decisions that caused them are eighteen months old and the commercial conditions that produced them may have changed twice.
It also shapes what firms do in response. A contractor watching its order book thin does not usually cut staff while it still has work on site, because the people are needed to finish it and would be expensive to replace. What tends to happen first is quieter: less hiring, more competitive bidding on the work that is available, and thinner margins as firms buy backlog to keep teams occupied.
Those effects show up in company results long before they show up in national output statistics, which is a reason to treat contractor commentary in the next reporting season as the more sensitive indicator.
Infrastructure Is Carrying the Sector
Within the output figures, infrastructure new work grew 1.9% in the quarter and was the main positive contributor. Five of the nine sectors grew.
Infrastructure is the part of construction least tied to the private cycle. It is largely publicly commissioned or regulated-utility work, planned years ahead, and it continues through periods when commercial developers stop. That makes it a stabiliser, and in this quarter it is doing that job.
It also means the sector’s headline resilience is partly a public-spending fact rather than a market one. Five of nine sectors growing is a reasonable spread, but the largest positive contribution coming from the least cyclical category tells you something about where the demand is originating.
That pattern sits alongside the housebuilding picture, where private developers account for four in five starts and the public contribution is minimal. Different parts of construction are being held up by opposite halves of the economy.
Prices Rose 1.9%
Construction output prices rose 1.9% in the 12 months to June.
That is a modest rate by the standards of the past few years, and it matters for reading the output figures, which are measured in volume terms. When input prices are rising fast, a firm can bill more while building less, and the volume series is designed to strip that out.
At 1.9%, price effects are not doing much distorting in either direction. The output movements described here are close to real changes in the amount of work done.
For contractors, near-2% cost inflation is a workable environment for fixed-price tendering, which is itself a small piece of good news in a quarter whose forward numbers are weak. Bidding is far harder when input costs are moving faster than the contract allows.
The ONS Found an Error Going Back to 2022
The bulletin also carries a correction that deserves more attention than a data note usually gets.
A data error was identified in the public housing new work sector dating from January 2022. Correcting it increases the level of construction output by approximately 1.2% from that date onward. The ONS states that GDP growth is unaffected to one decimal place.
Two things follow. The level of construction activity since early 2022 was slightly higher than previously published, which is a mild upgrade to a sector that has been reported as struggling for most of that period. And the growth rates, which are what commentary is built on, barely move, because a level shift applied consistently across four years cancels out of period-to-period comparisons.
It is a good illustration of why level and rate are different questions. Anyone who has been describing construction as smaller than it is has been mildly wrong for four years; anyone describing its direction of travel has not.
Publishing the correction plainly, with its size and its consequence for GDP, is the right way to handle it.
What to Watch Next
Three things will determine whether this quarter reads as noise or as a turn.
The first is whether orders fall again. A single 11.8% drop in a lumpy series proves little; two consecutive quarters would be a trend, and would start feeding through to output within a couple of quarters after that.
The second is whether infrastructure keeps growing. It is currently the main positive contributor, and it is the category most exposed to a change in public capital budgets rather than to market conditions.
The third is whether the monthly series stops falling. April, May and June were all negative, and the quarterly rise is an artefact of where the quarter began. If July and August are also negative, the third quarter will not have a strong March to lean on, and the quarterly figure will look very different. It is the same reading problem as a survey index that rises sharply while still signalling contraction: the direction of a number and the level of a number answer different questions, and only one of them is usually in the headline.
About The Author





More Stories
LearnUpon Secured $50m Without Selling a Single Share
La Cordée Is Closing With $13 Million Owed and 210 Jobs Lost
Pensioners Would Carry Half the Private Health Insurance Rebate Cut